Tenant Satisfaction Measures

Welcome to our Tenant Satisfaction Measures (TSMs) page. Here you can find out how we’re doing against the measures set by the Regulator for Social Housing. The measures are designed to help you understand how we’re performing and support greater transparency and accountability in social housing.

Our results this year

Our results show that overall satisfaction among social and affordable rent customers was 60.7%. Shared ownership customers reported lower satisfaction at 27.7%. 

Performance has improved slightly across most areas last year, including overall satisfaction, repairs, safety and anti-social behaviour.

Overall, we recognise that our performance is not yet where we want it to be. We have a raft of improvement plans in place for key areas, such as repairs and complaints. These will bring about the positive changes needed to ensure we deliver better outcomes for you. You can read more about this work below. 

In 2024/25, we changed the way we carry out the surveys, undertaking more on the telephone and fewer online. This has strengthened our approach, bringing us in line with the methodology used by other housing associations. It means we can more accurately benchmark our performance against other landlords, so you can better compare how we are doing.  Changing methodology can have an impact on scores.

Thank you

We value and recognise the importance of customer feedback in shaping services and driving improvements. Thank you to everyone who took the time to take part in our surveys and we encourage you to continue sharing your experiences with us. 

Customers have been and will continue to be central to shaping how we deliver and improve services, including through our new Customer Participation Panel and service improvement groups. Find out about different ways you can get involved.

What are TSMs?

The TSMs are a set of measures that all registered social housing providers must publish annually. They are split into two types:

  • Tenant perception measures – based on surveys asking residents about their experiences.

  • Management information measures – based on data collected by the landlord (e.g. repairs, complaints, safety checks).

What do they cover?

The measures are grouped into key themes:

  • Overall satisfaction (e.g. satisfaction with our services)

  • Keeping properties in good repair (e.g. time taken to complete repairs)

  • Maintaining building safety (e.g. gas and fire safety checks)

  • Respectful and helpful engagement (e.g. how well residents feel listened to)

  • Effective handling of complaints

  • Responsible neighbourhood management (e.g. dealing with anti-social behaviour)

Our results 2024/25

Tenant perception measures
Social and affordable rent customers
Shared ownership customers
60.7%
Satisfaction with our overall service
27.7%
Satisfaction with our overall service
71.8%
Satisfaction that your home is safe
47.1%
Satisfaction that your home is safe
54.6%
Satisfaction that we listen to your views and act upon them
23.8%
Satisfaction that we listen to your views and act upon them
66.9%
Satisfaction that we keep you informed about things that matter to you
41.2%
Satisfaction that we keep you informed about things that matter to you
69.3%
Agreement that we treat you fairly and with respect
39.3%
Agreement that we treat you fairly and with respect
30.9%
Satisfaction with our approach to handling your complaint
16%
Satisfaction with our approach to handling your complaint
61.5%
Satisfaction that we keep communal areas clean and well maintained
45%
Satisfaction that we keep communal areas clean and well maintained
56.8%
Satisfaction that we make a positive contribution to your neighbourhood
28%
Satisfaction that we make a positive contribution to your neighbourhood
55.6%
Satisfaction with our approach to handling anti social behaviour
25.4%
Satisfaction with our approach to handling anti social behaviour
63.7%
Satisfaction with the overall repairs service
61.1%
Satisfaction with the time taken to complete your most recent repair
63.8%
Satisfaction that your home is well maintained

Management information measures

Social, affordable rent and shared ownership customers

Overview

For our social and affordable rent customers, the higher scoring areas were:

  • Home that is safe – 71.8%

  • Treated fairly and with respect – 69.3%

  • Kept informed – 66.9%

The lowest scoring area was satisfaction with how we handle complaints. This highlights a consistent area of concern and reinforces the need for us to continue to focus on improvements in how complaints are managed and resolved.

Esson and volunteer at Havelock community centre

Repairs

We’ve seen an improvement in the proportion of repairs completed within our target timescales. This was 85.4% for emergency repairs and 74.2% for routine repairs, compared to 68.8% and 66.6% respectively the year before.

Health and safety

Your safety is our number one priority, and this year’s results show that our compliance with required health and safety standards is high for gas safety (96%), fire risk assessments (99.5%) and legionella risk assessments (92.6%). We had carried out the required lift checks on 83.7% of our lifts, and work is on-going to make improvements in this area. This mainly relates to 400 blocks that are managed by third-party managing agents.

Anti-social behaviour

Anti-social behaviour (ASB) remains a key area of focus. In 2024/25, we recorded 37.7 ASB cases per 1,000 homes, which was an increase from 23 the year before. We believe this may in part be due to the work we’ve done to raise awareness about reporting ASB.

Whilst the TSMs measure the volume of anti-social behaviour cases, they don’t reflect how effectively we are managing these cases, for example, to say how quickly we are getting in touch with you and resolving cases.  To help us understand and measure this better, we’ve included new measures to help us track our performance.

Complaints

We received a high volume of complaints in 2024/25. This was a 49% rise compared to the year before, reflecting increased customer scrutiny and greater confidence in using our complaints process to raise dissatisfaction. We responded to 70.4% of complaints at stage one and 73.7% at stage two. This is an improvement from the year before, demonstrating early impact from our Complaints Improvement Plan.

Key themes raised include delays, poor communication, and dissatisfaction with service quality. We have centralised how we handle complaints, expanded our team and introduced a new quality assurance process. Further work is under way to respond to all complaints within the set timeframes, reduce the number of complaints escalated to stage 2, improve the quality of our responses, and rebuild trust with customers.

How we carry out the surveys

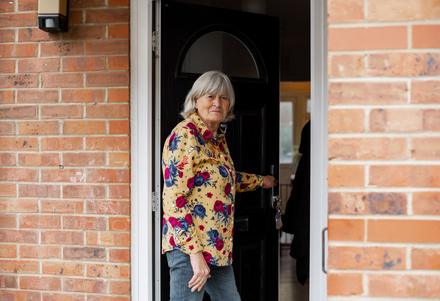
The surveys are carried out with customers living in low-cost rental homes (i.e. social rent, affordable rent) and low-cost home ownership properties (i.e. shared ownership). This is in line with the requirements set by the regulator.

An external company called The Leadership Factor (TLF)  carry out the surveys on our behalf, either via text message, email or telephone.

TLF follows the Market Research Society Code of Conduct and gathers the data in line with GDPR. Your answers are subject to normal market research rules of confidentiality.

More information

To find out more about the measures visit the Regulator of Social Housing.

You can view our 2023/24 results here.